Football player size, such as height, hand span, arm length, body mass & skinfolds, are all important factors in performance. Tall players are at an advantage, though there are many successful AFL players that are not tall. An excess of body fat would affect the AFL player's ability to jump vertically, move freely around the ground, and the extra weight will increase fatigue. The width of the hand outstretched may be related to the ability to grab opposition players and mark the ball. Longer arms may be an advantage for football players when taking a mark or tackling an opposition player. See more about AFL player anthropometry.
We have analyzed an Australian Football League database publicly available on Kaggle, which included all senior AFL players from 2012 till 2018. The database included the height, weight, position played and age of 1,377 players. The players' BMI was calculated from the height and weight data. While this data has been useful and interesting to compare the anthropometric data between player playing position on the field, the height and weight of players much further back in time would provide much more interesting analysis.
Average Height and Weight Values 2012-2018
There are clear differences in the body size of players depending on the position played on the field (see table below). Ruck players are obviously the tallest, followed by the defenders. Player weight was also highest for the ruckmen.
| Position | Number | Height (cm) | Weight (kg) |
|---|---|---|---|
| Defender | 452 | 188.9 (range 177-204) | 87.9 (range 73-105) |
| Forward | 471 | 186.8 (range 167-211) | 86.4 (range 67-115) |
| Midfield | 360 | 184.4 (range 169-195) | 84.0 (range 68-99) |
| Ruck | 94 | 201.4 (range 190-211) | 102.0 (range 85-118) |
| Total Average | 1377 | 187.9 (range 167-211) | 87.3 (range 67-118) |
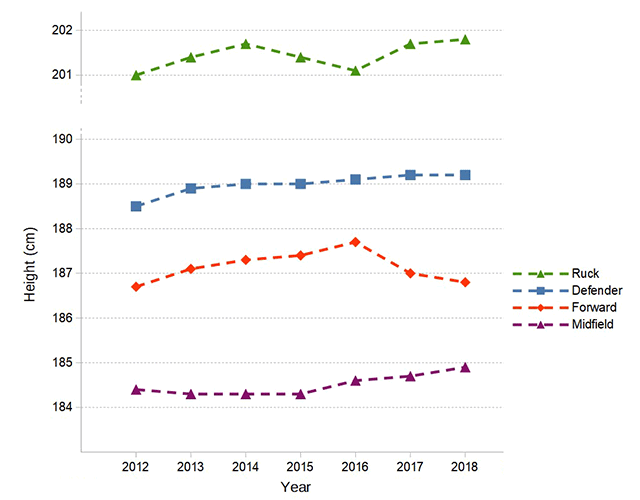
Average Height Over Time by Position
Although there is a clear difference in the average height of players per position, there has been little change in these height values over the years from 2012 until 2018. If you wish to convert the height values to imperial units you can use one of our calculators.

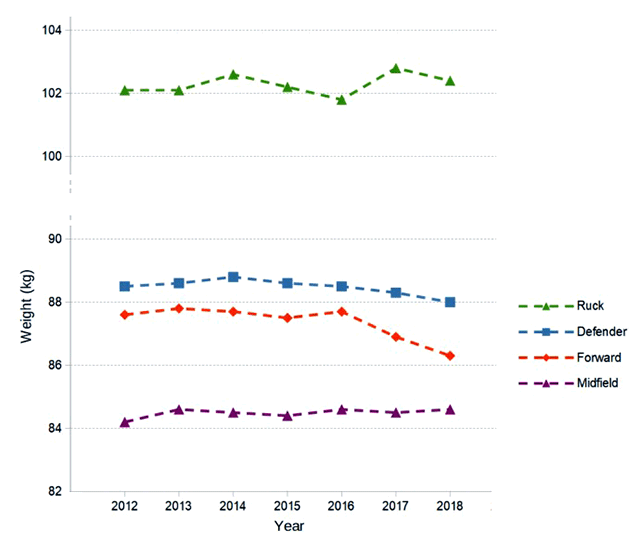
Average Weight Over Time by Position
Like the height data, there is a clear difference in the average weight of players per position, though generally there has been little change in these weights over the years from 2012 until 2018, with the exception of the forwards who show a trend of a small decrease in 2017 and 2018. If you wish to convert the weight values back to imperial units you can use one of our calculators.

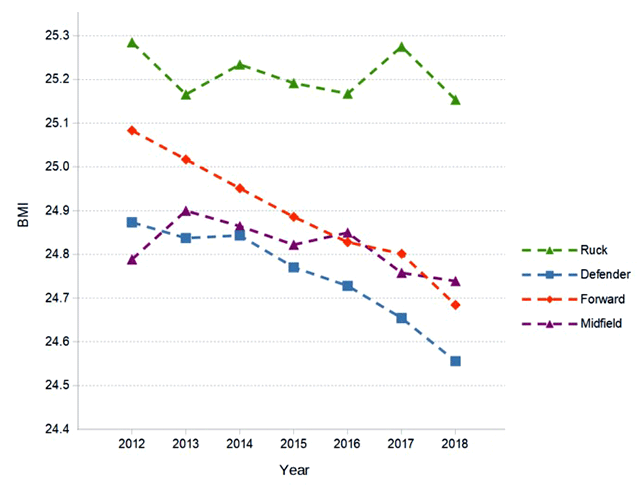
Average BMI Over Time by Position
Using the height and weight measures, we have calculated the average BMI measurement, which is a general (though flawed, particularly with athletes) measure of leanness. Unlike the height and weight values, there are some differences over time evident for BMI. For the forwards and defenders, BMI has decreased over the time period analyzed. The fitness expectations of the forwards and defenders have been increasing, and subsequently they have shown this trend of becoming leaner.

Data Source
The Australian Football League Database is available on from the Kaggle website. For the database, date of birth, height, weight & playing position was collected from www.footywire.com, all other data was extracted from https://afltables.com. For players listed in more than one playing position, their data was used in the analysis of each position.
Related Pages
- AFL Anthropometry — height, weight and body composition of AFL players
- Tallest and Shortest AFL Players
- Sport Specific Anthropometry — about body size and composition of many sports
- Indigenous AFL players are shorter, lighter and faster
- A discussion of fitness components of AFL
- Fitness for AFL
- About the AFL draft camp, and results from previous years.
- Poll: fitness components for AFL
- All about anthropometry testing


 Current Events