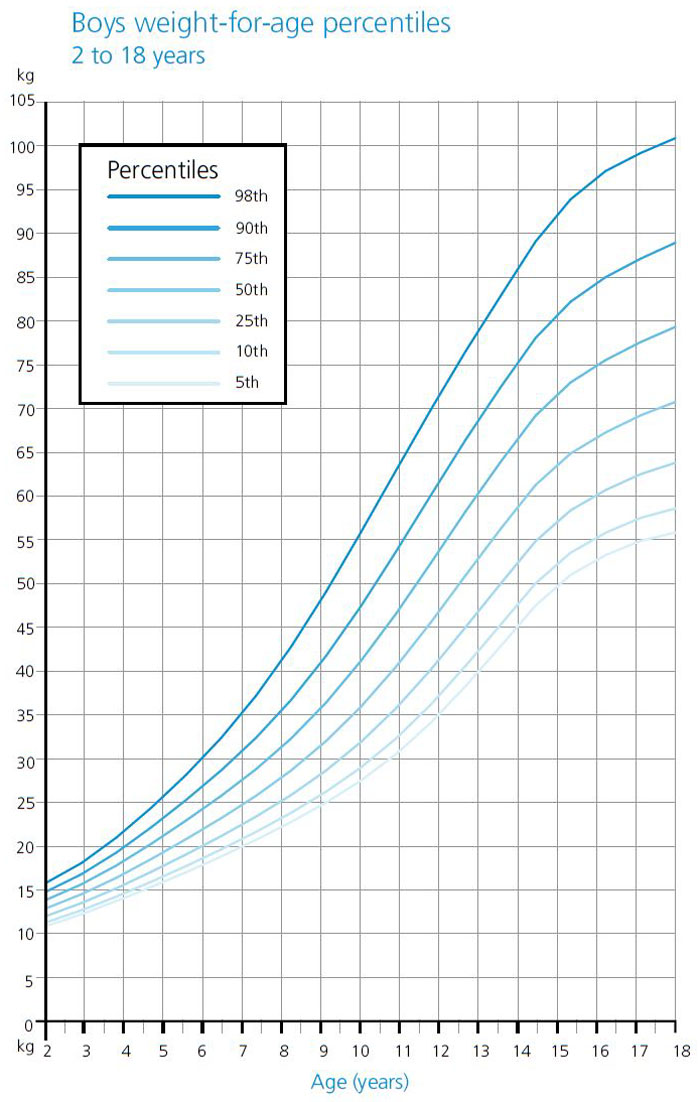
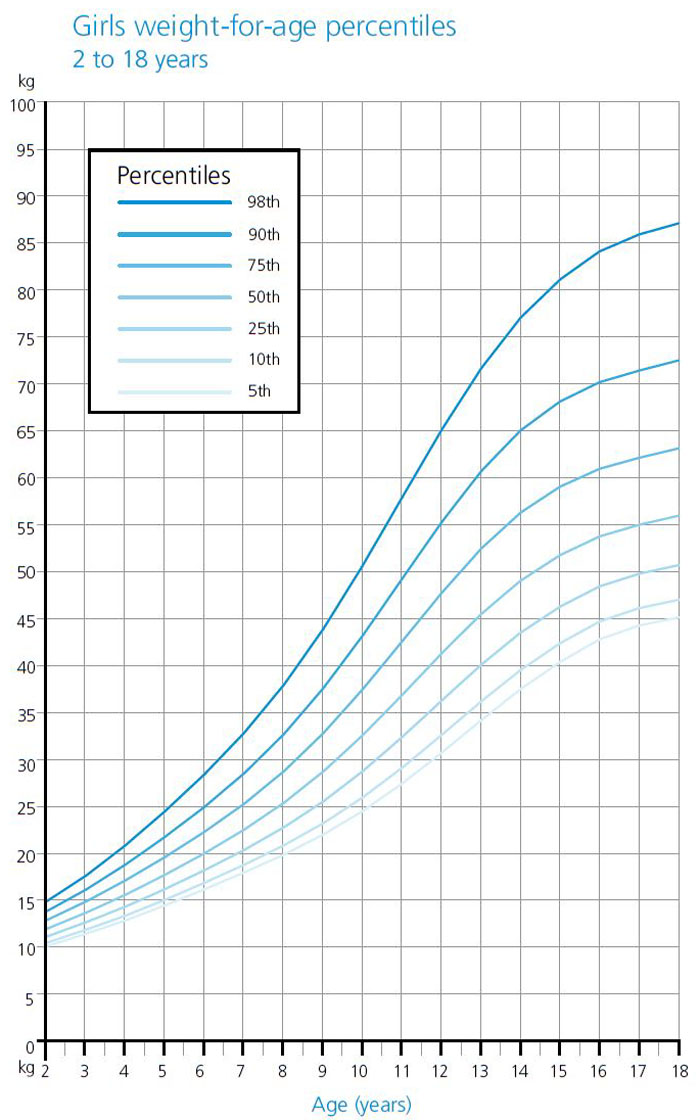
Here are some weight growth charts for boys and girls aged 2-18 years. Use a standard procedure to measure weight no more than once a month. Mark the chart at the point where the measurement value intersects with the age of the child. Join a line between consecutive dot points to get an impression of the changes over time. There are also baby weight charts for children below two years. See more information about how to use and interpret growth charts.
The charts below have the grids scaled to metric units (kg). If you need, you can use this calculator to convert kg and grams to pounds, and vice versa.
Table of boys height-for-age percentiles (2-18 years)

Table of girls weight-for-age percentiles (2-18 years)

These tables are created using data provided by the World Health Organisation Child Growth Standards.
What are percentiles? Percentiles are measurements that show where your growth is compared with others. If your measurement is in the 50th percentile, it means that 50% of people of the same age are heavier and the other 50% are lighter.
Related Pages
- Measuring body weight
- Calculating Ideal Weight
- height growth charts — monitoring height changes over time.
- Tanner developmental stages
- Use a calculator to convert kg and grams to pounds, and vice versa
- Records for the heaviest and lightest humans
- About weight loss
- Other Anthropometric Tests
- About body size testing


 Current Events